Cycling by Javi Parejo on March 11, 2018 @ 9:14 AM

Santa Amalia Ciclismo

Event: -- Event Type: Uncategorized Course: --
44.82 km
Distance
2:27:34
Time
18.2 kph
Avg Speed
490 m
Total Ascent
MarkerMarker
1 km
3000 ft
Slower
Faster
Elevation

Chart

Chart with 1470 data points.
The chart has 1 X axis displaying values. Data ranges from 0 to 8741.
The chart has 1 Y axis displaying values. Data ranges from 238.39999389648438 to 398.20001220703125.
Chart annotations summary
End of interactive chart.
Speed

Chart

Chart with 1470 data points.
The chart has 1 X axis displaying values. Data ranges from 0 to 8741.
The chart has 1 Y axis displaying values. Data ranges from 0 to 51.991201400756836.
Chart annotations summary
Avg: 18.2 kph
End of interactive chart.
Heart Rate

Chart

Chart with 1470 data points.
The chart has 1 X axis displaying values. Data ranges from 0 to 8741.
The chart has 1 Y axis displaying values. Data ranges from 88 to 182.
Chart annotations summary
Avg: 144 bpm
End of interactive chart.
Temperature

Chart

Chart with 1470 data points.
The chart has 1 X axis displaying values. Data ranges from 0 to 8741.
The chart has 1 Y axis displaying values. Data ranges from 6 to 15.
Chart annotations summary
Avg: 9.0 °C
End of interactive chart.

Distance

44.82 km
Distance

Calories

1,132
Calories

Heart Rate

144 bpm
Avg HR
182 bpm
Max HR

Timing

2:27:34
Time
2:24:59
Moving Time
3:22:01
Elapsed Time

Elevation

490.0 m
Total Ascent
494.0 m
Total Descent
238.4 m
Min Elev
398.2 m
Max Elev

Pace/Speed

18.2 kph
Avg Speed
18.6 kph
Avg Moving Speed
52.0 kph
Max Speed

Temperature

9.0 °C
Avg Temp
6.0 °C
Min Temp
15.0 °C
Max Temp
Laps Time Cumulative Time Distance Avg Speed Avg HR Max HR Total Ascent Total Descent Calories Avg Temperature Max Speed Moving Time Avg Moving Speed
1 2:27:34 2:27:34 44.82 18.2 144 182 490 494 4,743 9.0 52.0 2:24:59 18.6
Summary 2:27:34 2:27:34 44.82 18.2 144 182 490 494 1,132 9.0 52.0 2:24:59 18.6
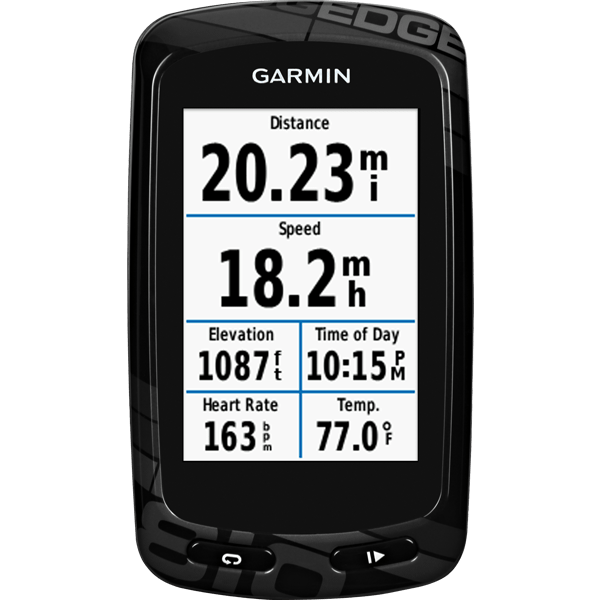
Garmin Edge 810
Software: 6.10
Summary Data: Original
BESbswy