Running by Miika Takala on 17 March 2021 @ 07:13

6km juosten töihin

Event: -- Event Type: Uncategorized Course: -- Gear:
6.04 km
Distance
29:15
Time
4:51 /km
Avg Pace
48 m
Total Ascent
319
Calories
MarkerMarker
300 m
1000 ft
Select a different data overlay for your GPS track
Current overlay: Pace
-1.1° Light Rain 11
  • Feels like -4.4°
  • 11 kph N wind
  • 93% humidity
  • Source: EFJY
Slower
Faster
Elevation

Chart

Chart with 1756 data points.
The chart has 1 X axis displaying values. Data ranges from 0 to 1754.
The chart has 1 Y axis displaying values. Data ranges from 33.400001525878906 to 64.80000305175781.
Chart annotations summary
End of interactive chart.

Chart

Chart with 1756 data points.
The chart has 1 X axis displaying values. Data ranges from 0 to 1754.
The chart has 1 Y axis displaying values. Data ranges from 4.262574501485156 to 13.22751332763021.
Chart annotations summary
Avg: 4:51 /km
End of interactive chart.
Heart Rate

Chart

Chart with 1756 data points.
The chart has 1 X axis displaying values. Data ranges from 0 to 1754.
The chart has 1 Y axis displaying values. Data ranges from 83 to 137.
Chart annotations summary
Avg: 129 bpm
End of interactive chart.
Performance Condition

Chart

Chart with 1756 data points.
The chart has 1 X axis displaying values. Data ranges from 0 to 1754.
The chart has 1 Y axis displaying values. Data ranges from 1 to 3.
Chart annotations summary
End of interactive chart.
Stride Length

Chart

Scatter chart with 1756 points.
The chart has 1 X axis displaying values. Data ranges from 0 to 1754.
The chart has 1 Y axis displaying values. Data ranges from 0.606 to 1.5030000000000001.
Chart annotations summary
Avg: 1.25 m
End of interactive chart.
Run Cadence

Chart

Scatter chart with 1756 points.
The chart has 1 X axis displaying values. Data ranges from 0 to 1754.
The chart has 1 Y axis displaying values. Data ranges from 102 to 188.
Chart annotations summary
Avg: 167 spm
End of interactive chart.

Chart

Scatter chart with 1756 points.
The chart has 1 X axis displaying values. Data ranges from 0 to 1754.
The chart has 1 Y axis displaying values. Data ranges from 4.179999828338623 to 16.18000030517578.
Chart annotations summary
Avg: 8.0 %
End of interactive chart.

Chart

Scatter chart with 1755 points.
The chart has 1 X axis displaying values. Data ranges from 0 to 1754.
The chart has 1 Y axis displaying values. Data ranges from 48.75 to 51.029998779296875.
Chart annotations summary
Avg: 49.9% L / 50.1% R
End of interactive chart.
Respiration Rate

Chart

Chart with 1756 data points.
The chart has 1 X axis displaying values. Data ranges from 0 to 1754.
The chart has 1 Y axis displaying values. Data ranges from 22.18000030517578 to 41.7599983215332.
Chart annotations summary
Avg: 33 brpm
End of interactive chart.
Temperature

Chart

Chart with 1756 data points.
The chart has 1 X axis displaying values. Data ranges from 0 to 1754.
The chart has 1 Y axis displaying values. Data ranges from 13 to 29.
Chart annotations summary
Avg: 18.7 °C
End of interactive chart.
Power

Chart

Chart with 1756 data points.
The chart has 1 X axis displaying values. Data ranges from 0 to 1754.
The chart has 1 Y axis displaying values. Data ranges from 69 to 264.
Chart annotations summary
End of interactive chart.
Cadence

Chart

Chart with 1756 data points.
The chart has 1 X axis displaying values. Data ranges from 0 to 1754.
The chart has 1 Y axis displaying values. Data ranges from 55 to 91.
Chart annotations summary
End of interactive chart.
Ground Time

Chart

Chart with 1756 data points.
The chart has 1 X axis displaying values. Data ranges from 0 to 1754.
The chart has 1 Y axis displaying values. Data ranges from 214 to 1018.
Chart annotations summary
End of interactive chart.
Vertical Oscillation

Chart

Chart with 1756 data points.
The chart has 1 X axis displaying values. Data ranges from 0 to 1754.
The chart has 1 Y axis displaying values. Data ranges from 0 to 10.
Chart annotations summary
End of interactive chart.
Form Power

Chart

Chart with 1756 data points.
The chart has 1 X axis displaying values. Data ranges from 0 to 1754.
The chart has 1 Y axis displaying values. Data ranges from 22 to 66.
Chart annotations summary
End of interactive chart.
Leg Spring Stiffness

Chart

Chart with 1756 data points.
The chart has 1 X axis displaying values. Data ranges from 0 to 1754.
The chart has 1 Y axis displaying values. Data ranges from 0 to 8.625.
Chart annotations summary
End of interactive chart.

Distance

6.04 km
Distance

Nutrition & Hydration

319
Total Calories Burned
--
Calories Consumed
-319
Calories Net
275 ml
Est. Sweat Loss
-- ml
Fluid Consumed
-275 ml
Fluid Net

Respiration Rate

33 brpm
Avg Respiration Rate
22 brpm
Min Respiration Rate
42 brpm
Max Respiration Rate

Training Effect

Recovery
Primary Benefit
2.2 Maintaining
Aerobic
0.0 No Benefit
Anaerobic
38
Exercise Load

Heart Rate

129 bpm
Avg HR
137 bpm
Max HR

Timing

29:15
Time
29:12
Moving Time
29:21
Elapsed Time

Elevation

47.6 m
Total Ascent
60.8 m
Total Descent
33.4 m
Min Elev
64.8 m
Max Elev

Pace/Speed

4:51 /km
Avg Pace
4:50 /km
Avg Moving Pace
4:16 /km
Best Pace

Running Dynamics

167 spm
Avg Run Cadence
188 spm
Max Run Cadence
1.25 m
Avg Stride Length
8.0 %
Avg Vertical Ratio
10.3 cm
Avg Vertical Oscillation
49.9% L / 50.1% R
Avg GCT Balance
229 ms
Avg Ground Contact Time

Temperature

18.7 °C
Avg Temp
13.0 °C
Min Temp
29.0 °C
Max Temp
Laps Time Cumulative Time Distance Avg Pace Avg GAP Avg HR Max HR Total Ascent Total Descent Avg Power Avg W/kg Max Power Max W/kg Avg Run Cadence Avg Ground Contact Time Avg GCT Balance Avg Stride Length Avg Vertical Oscillation Avg Vertical Ratio Calories Avg Temperature Best Pace Max Run Cadence Moving Time Avg Moving Pace Lap Power
1 5:36.5 5:36.5 1.00 5:37 -- 125 135 25 10 -- -- -- -- 173 254 49.5% L / 50.5% R 1.11 8.3 7.3 60 26.0 4:37 184 5:36.5 5:37 206
2 4:38.4 10:15 1.00 4:38 -- 128 137 5 25 -- -- -- -- 169 223 50.0% L / 50.0% R 1.26 10.4 8.0 53 21.0 4:26 188 4:38.4 4:38 220
3 4:43.6 14:59 1.00 4:44 -- 131 135 1 8 -- -- -- -- 166 223 49.7% L / 50.3% R 1.29 10.7 8.1 54 19.0 4:25 174 4:43 4:43 227
4 4:39.6 19:38 1.00 4:40 -- 131 134 0 1 -- -- -- -- 164 222 49.7% L / 50.3% R 1.31 11.1 8.2 52 17.0 4:32 169 4:39.6 4:40 231
5 4:36.7 24:15 1.00 4:37 -- 132 136 5 6 -- -- -- -- 164 221 50.0% L / 50.0% R 1.33 11.1 8.1 50 15.0 4:30 167 4:36.7 4:37 233
6 4:44.1 28:59 1.00 4:44 -- 130 136 13 10 -- -- -- -- 166 228 50.4% L / 49.6% R 1.23 10.6 8.5 48 13.0 4:16 180 4:43 4:43 228
7 0:15.8 29:15 0.04 6:40 -- 125 127 0 0 -- -- -- -- 159 231 50.8% L / 49.2% R 1.25 11.1 8.9 2 13.0 4:51 164 0:15 6:19 225
Summary 29:15 29:15 6.04 4:51 129 137 48 61 167 229 49.9% L / 50.1% R 1.25 10.3 8.0 319 18.7 4:16 188 29:12 4:50 --
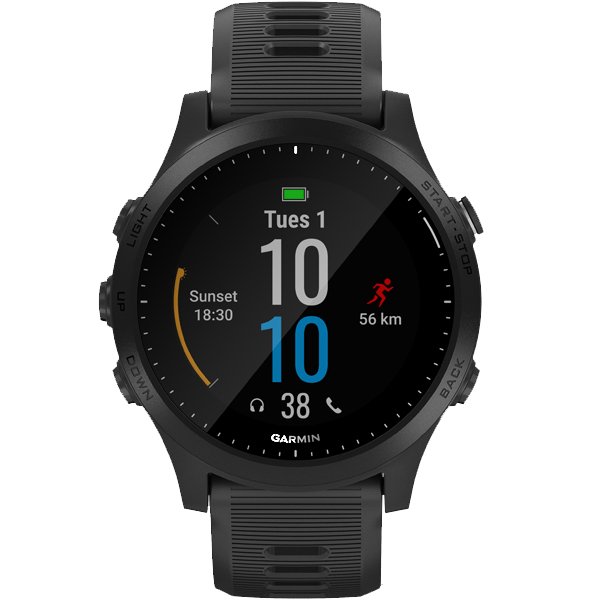
Forerunner 945
Software: 6.20
Summary Data: Original
Stryd Zones | Data Field
b7fc9884-0f3e-4d29-ba67-401546c01dd8
BESbswy