9.61 mi
Distance59:44
Time9.7 mph
Avg Speed30 ft
Total Ascent

500 m
2000 ft
Select a different data overlay for your GPS track
Current overlay: Speed
Current overlay: Speed
64.0°
 12
12
- Feels like 64.0°
- 12 mph SSW wind
- 94% humidity
- Source: KHXD
Slower
Faster
Elevation
Speed
Temperature
Distance
9.61 mi
Distance
Calories
321
Calories
Timing
59:44
Time
59:11
Moving Time
1:17:32
Elapsed Time
Elevation
29.5 ft
Total Ascent
45.9 ft
Total Descent
-13.1 ft
Min Elev
13.8 ft
Max Elev
Pace/Speed
9.7 mph
Avg Speed
9.7 mph
Avg Moving Speed
15.0 mph
Max Speed
Temperature
61.6 °F
Avg Temp
57.2 °F
Min Temp
68.0 °F
Max Temp
| Laps | Time | Cumulative Time | Distance | Avg Speed | Total Ascent | Total Descent | Calories | Avg Temperature | Max Speed | Moving Time | Avg Moving Speed |
|---|---|---|---|---|---|---|---|---|---|---|---|
| 1 | 29:02 | 29:02 | 5.00 | 10.3 | 13 | 26 | 704 | 60.5 | 15.0 | 28:51 | 10.4 |
| 2 | 30:43 | 59:44 | 4.61 | 9.0 | 16 | 20 | 641 | 62.6 | 13.4 | 30:20 | 9.1 |
| Summary | 59:44 | 59:44 | 9.61 | 9.7 | 30 | 46 | 321 | 61.6 | 15.0 | 59:11 | 9.7 |
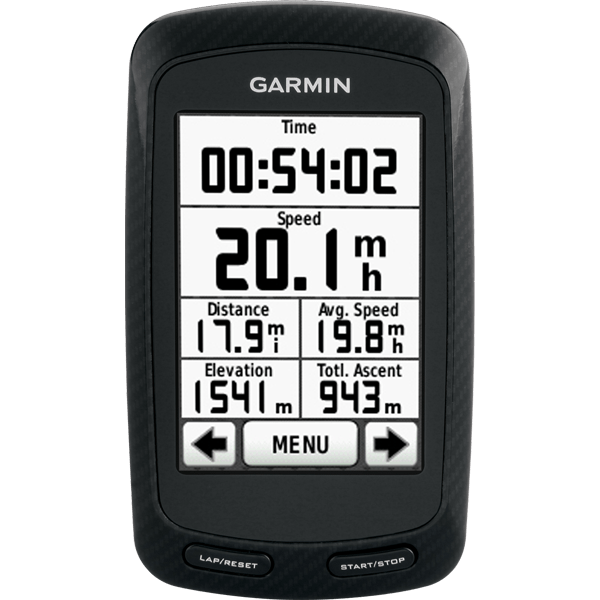
Garmin Edge 800
Software: 2.70
Summary Data: Original