7.85 mi
Distance44:16
Time10.6 mph
Avg Speed472 ft
Total Ascent

500 m
2000 ft
Select a different data overlay for your GPS track
Current overlay: Speed
Current overlay: Speed
Slower
Faster
Elevation
Speed
Distance
7.85 mi
Distance
Calories
798
Calories
Timing
44:16
Time
43:49
Moving Time
44:16
Elapsed Time
Elevation
471.7 ft
Total Ascent
247.7 ft
Total Descent
-53.4 ft
Min Elev
193.8 ft
Max Elev
Pace/Speed
10.6 mph
Avg Speed
10.7 mph
Avg Moving Speed
29.3 mph
Max Speed
| Laps | Time | Cumulative Time | Distance | Avg Speed | Total Ascent | Total Descent | Calories | Max Speed | Moving Time | Avg Moving Speed |
|---|---|---|---|---|---|---|---|---|---|---|
| 1 | 44:16 | 44:16 | 7.85 | 10.6 | 472 | 248 | 3,344 | 29.3 | 43:49 | 10.7 |
| Summary | 44:16 | 44:16 | 7.85 | 10.6 | 472 | 248 | 798 | 29.3 | 43:49 | 10.7 |
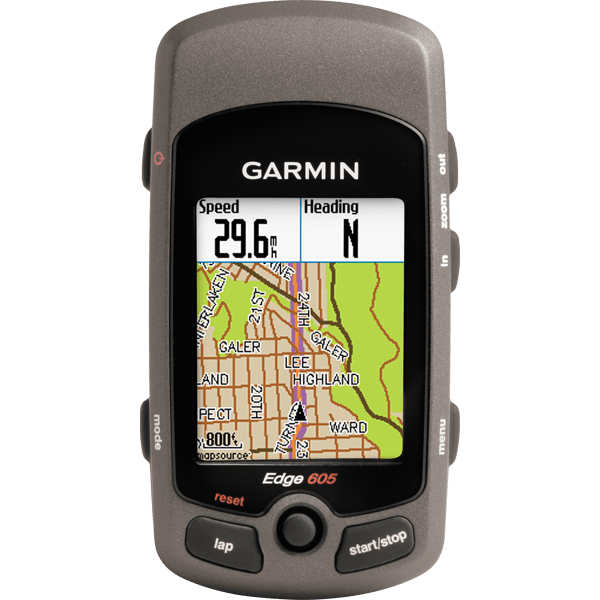
Garmin Edge 605
Software: 3.20
Summary Data: Original