1.75 mi
Distance8:26.2
Time12.4 mph
Avg Speed79 ft
Total Ascent

300 m
1000 ft
Select a different data overlay for your GPS track
Current overlay: Speed
Current overlay: Speed
Slower
Faster
Elevation
Speed
Distance
1.75 mi
Distance
Calories
111
Calories
Timing
8:26.2
Time
8:19
Moving Time
8:26.2
Elapsed Time
Elevation
78.9 ft
Total Ascent
90.6 ft
Total Descent
145.7 ft
Min Elev
247.0 ft
Max Elev
Pace/Speed
12.4 mph
Avg Speed
12.6 mph
Avg Moving Speed
24.0 mph
Max Speed
| Laps | Time | Cumulative Time | Distance | Avg Speed | Total Ascent | Total Descent | Calories | Max Speed | Moving Time | Avg Moving Speed |
|---|---|---|---|---|---|---|---|---|---|---|
| 1 | 8:26.2 | 8:26.2 | 1.75 | 12.4 | 79 | 91 | 465 | 24.0 | 8:19 | 12.6 |
| Summary | 8:26.2 | 8:26.2 | 1.75 | 12.4 | 79 | 91 | 111 | 24.0 | 8:19 | 12.6 |
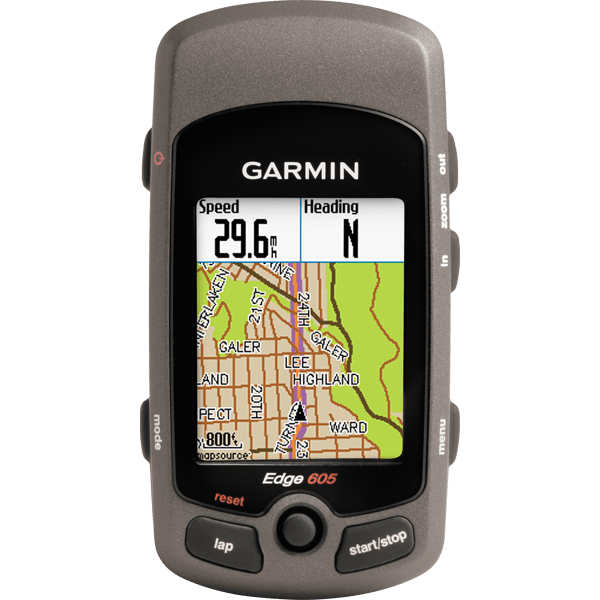
Garmin Edge 605
Software: 3.20
Summary Data: Original