21.28 km
Distance1:49:35
Time5:09 /km
Avg Pace267 m
Total Ascent2,013
Calories

500 m
2000 ft
Select a different data overlay for your GPS track
Current overlay: Pace
Current overlay: Pace
Slower
Faster
Distance
21.28 km
Distance
Calories
2,013
Calories
Heart Rate
175 bpm
Avg HR
192 bpm
Max HR
Timing
1:49:35
Time
1:49:25
Moving Time
1:49:36
Elapsed Time
Elevation
267.3 m
Total Ascent
316.8 m
Total Descent
104.0 m
Min Elev
182.3 m
Max Elev
Pace/Speed
5:09 /km
Avg Pace
5:08 /km
Avg Moving Pace
2:45 /km
Best Pace
| Laps | Time | Cumulative Time | Distance | Avg Pace | Avg GAP | Avg HR | Max HR | Total Ascent | Total Descent | Avg Power | Avg W/kg | Max Power | Max W/kg | Avg Run Cadence | Avg Ground Contact Time | Avg GCT Balance | Avg Stride Length | Avg Vertical Oscillation | Avg Vertical Ratio | Calories | Avg Temperature | Best Pace | Max Run Cadence | Moving Time | Avg Moving Pace | Avg Step Speed Loss | Avg Step Speed Loss Percent |
|---|---|---|---|---|---|---|---|---|---|---|---|---|---|---|---|---|---|---|---|---|---|---|---|---|---|---|---|
| 1 | 1:49:35 | 1:49:35 | 21.28 | 5:09 | -- | 175 | 192 | 267 | 317 | -- | -- | -- | -- | -- | -- | -- | -- | -- | -- | 8,435 | -- | 2:45 | -- | 1:49:25 | 5:08 | -- | -- |
| Summary | 1:49:35 | 1:49:35 | 21.28 | 5:09 | 175 | 192 | 267 | 317 | 2,013 | 2:45 | 1:49:25 | 5:08 |
Notes
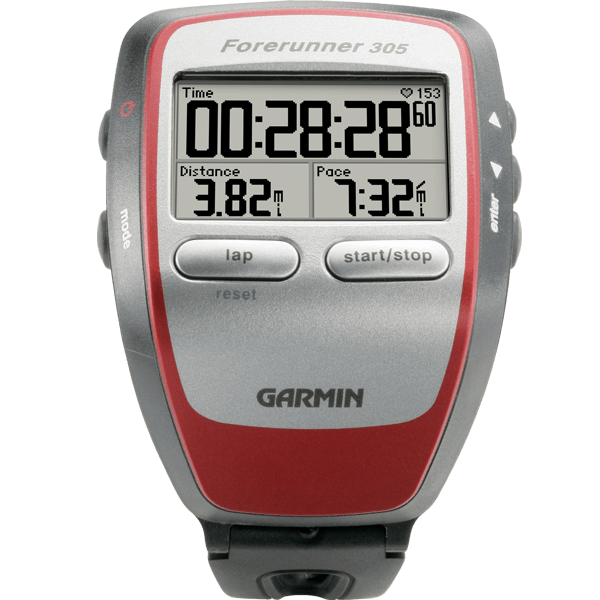
Garmin Forerunner 305
Software: 2.90
Summary Data: Original